- August 28, 2025
- Mins Read
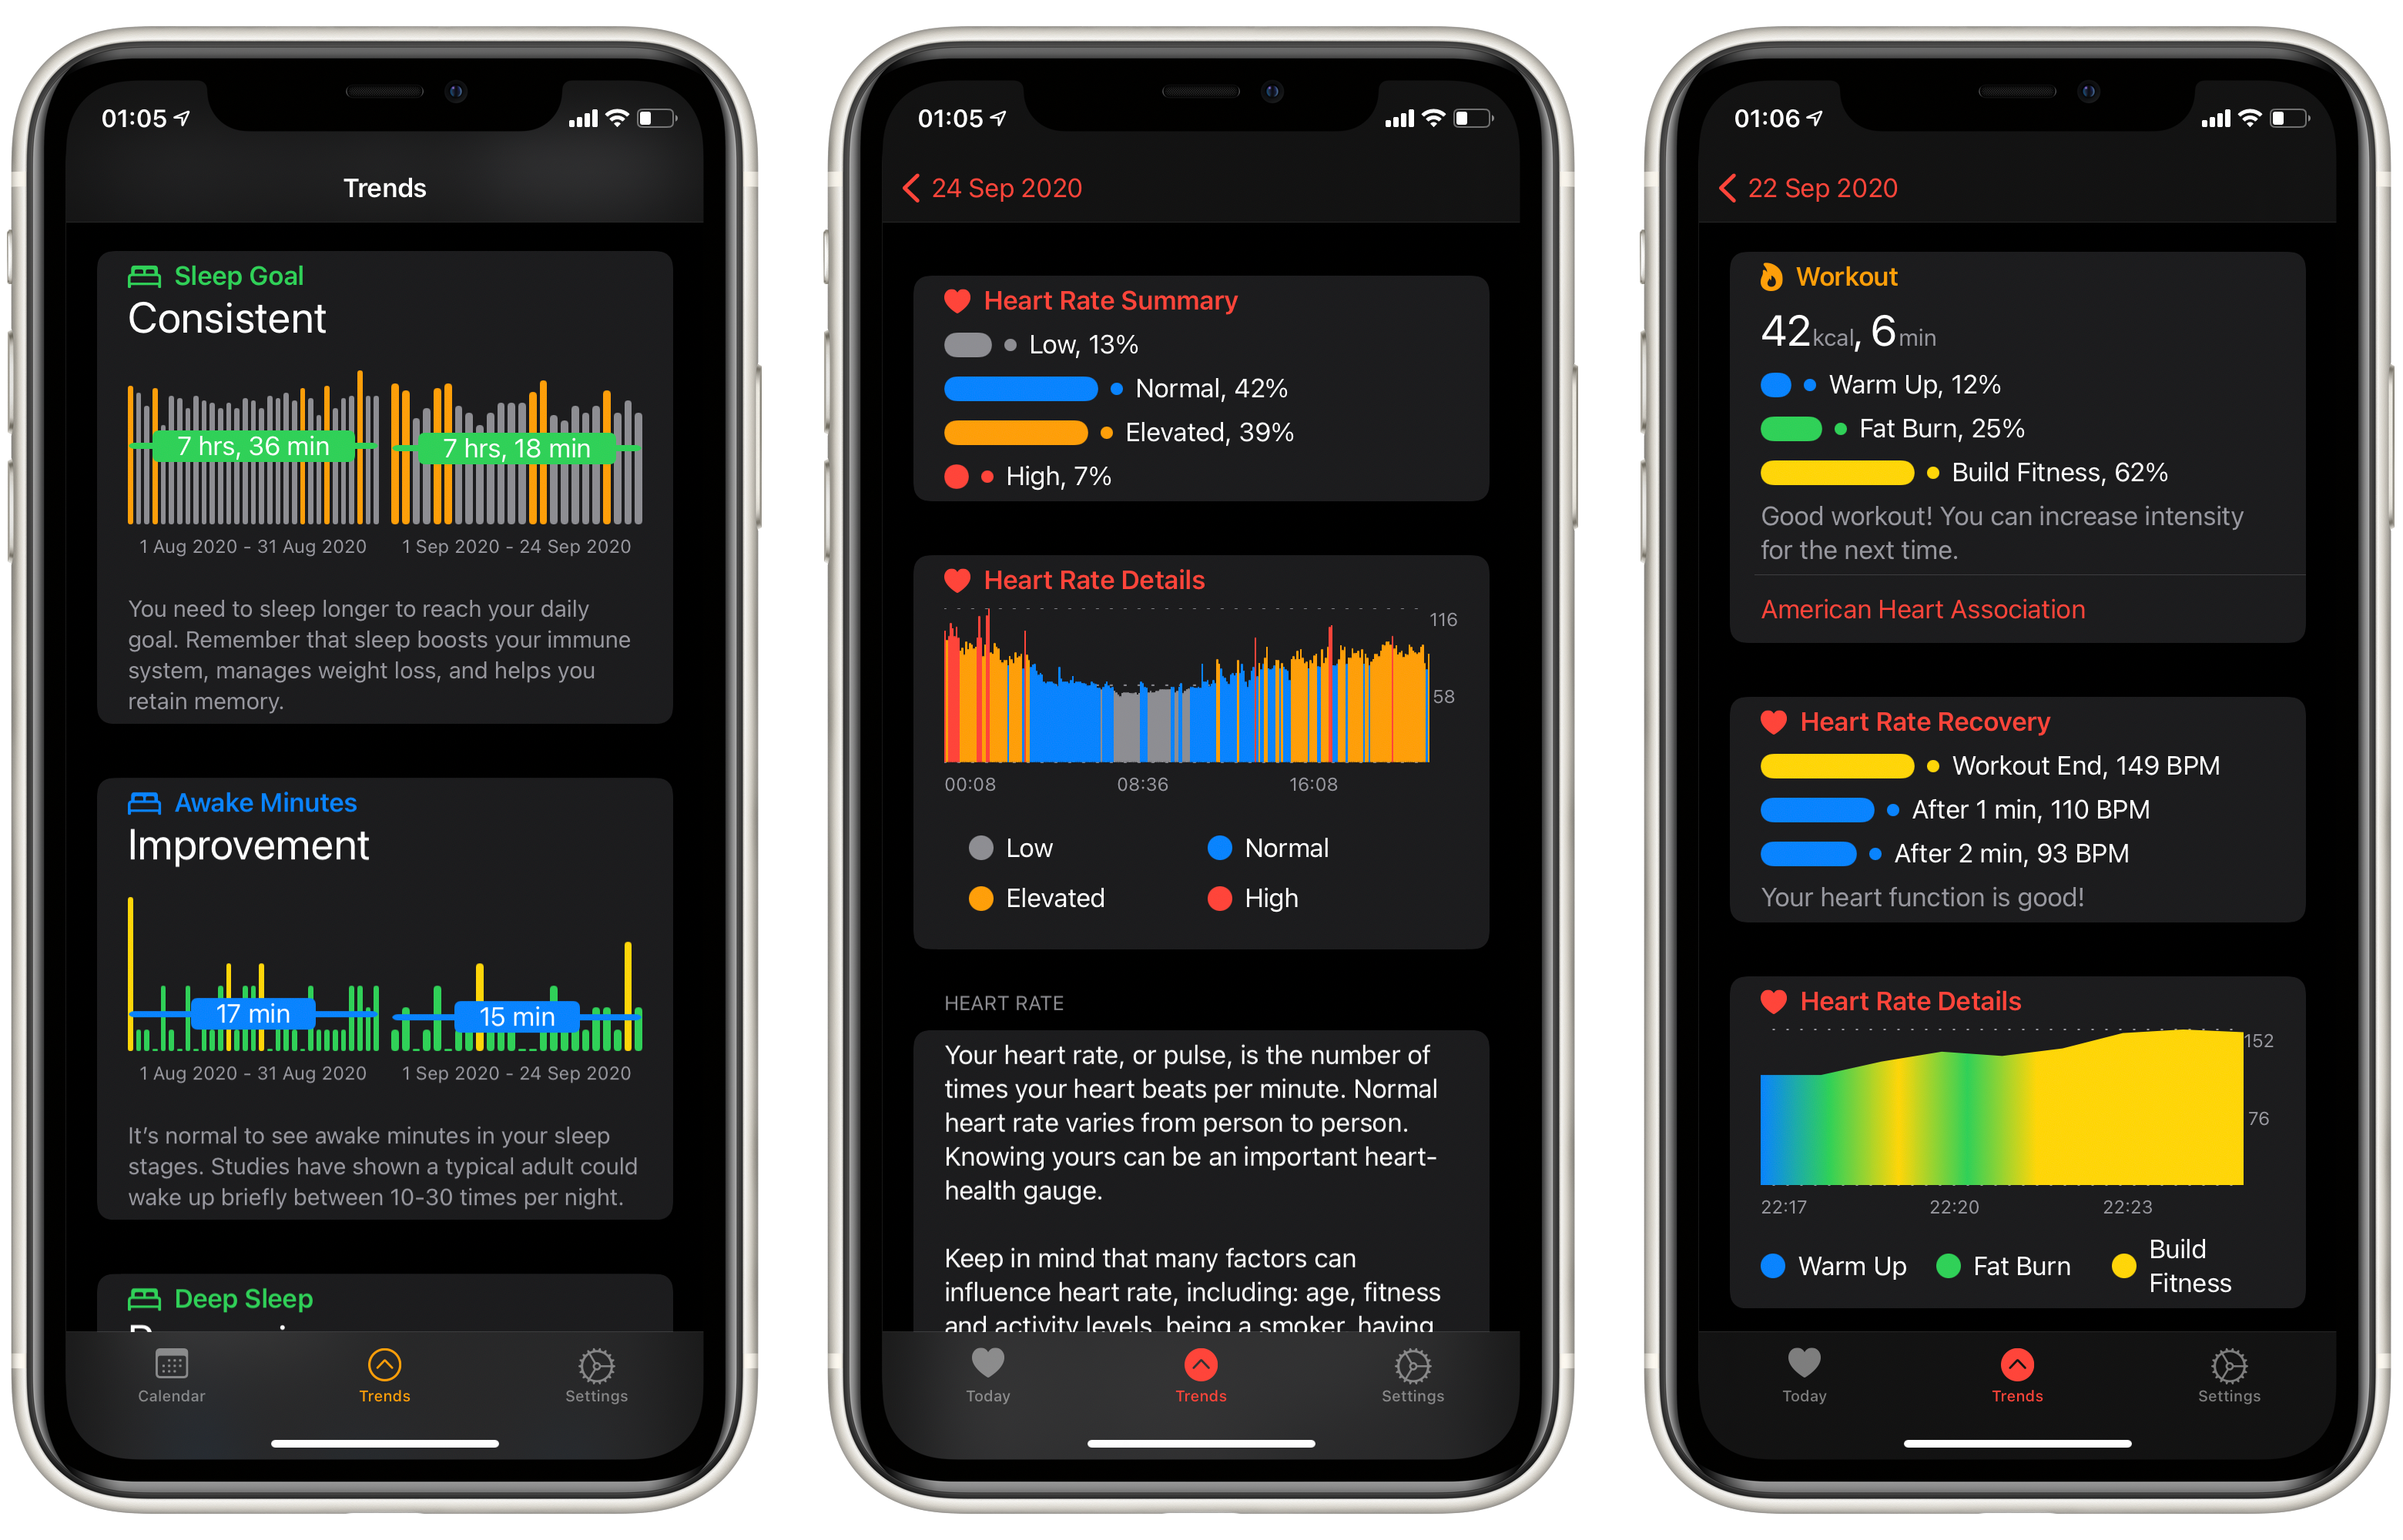
A simple line and bar charting library that support accessibility written using SwiftUI.
Usage
You can find all the examples here.
Vertical bar chart
                                                let highIntensity = Legend(color: .orange, label: “High Intensity”, order: 5)

let buildFitness = Legend(color: .yellow, label: “Build Fitness”, order: 4)

let fatBurning = Legend(color: .green, label: “Fat Burning”, order: 3)

let warmUp = Legend(color: .blue, label: “Warm Up”, order: 2)

let low = Legend(color: .gray, label: “Low”, order: 1)
let limit = DataPoint(value: 130, label: “5”, legend: fatBurning)
let points: [DataPoint] = [

.init(value: 70, label: “1”, legend: low),

.init(value: 90, label: “2”, legend: warmUp),

.init(value: 91, label: “3”, legend: warmUp),

.init(value: 92, label: “4”, legend: warmUp),

.init(value: 130, label: “5”, legend: fatBurning),

.init(value: 124, label: “6”, legend: fatBurning),

.init(value: 135, label: “7”, legend: fatBurning),

.init(value: 133, label: “8”, legend: fatBurning),

.init(value: 136, label: “9”, legend: fatBurning),

.init(value: 138, label: “10”, legend: fatBurning),

.init(value: 150, label: “11”, legend: buildFitness),

.init(value: 151, label: “12”, legend: buildFitness),

.init(value: 150, label: “13”, legend: buildFitness),

.init(value: 136, label: “14”, legend: fatBurning),

.init(value: 135, label: “15”, legend: fatBurning),

.init(value: 130, label: “16”, legend: fatBurning),

.init(value: 130, label: “17”, legend: fatBurning),

.init(value: 150, label: “18”, legend: buildFitness),

.init(value: 151, label: “19”, legend: buildFitness),

.init(value: 150, label: “20”, legend: buildFitness),

.init(value: 160, label: “21”, legend: highIntensity),

.init(value: 159, label: “22”, legend: highIntensity),

.init(value: 161, label: “23”, legend: highIntensity),

.init(value: 158, label: “24”, legend: highIntensity),

]
BarChartView(dataPoints: points, limit: limit)
Horizontal bar chart
                                                let warmUp = Legend(color: .blue, label: “Warm Up”, order: 2)

let low = Legend(color: .gray, label: “Low”, order: 1)
let points: [DataPoint] = [

.init(value: 70, label: “1”, legend: low),

.init(value: 90, label: “2”, legend: warmUp),

.init(value: 91, label: “3”, legend: warmUp),

.init(value: 92, label: “4”, legend: warmUp)

]
HorizontalBarChartView(dataPoints: points)
Line chart
                                                let buildFitness = Legend(color: .yellow, label: “Build Fitness”, order: 4)

let fatBurning = Legend(color: .green, label: “Fat Burning”, order: 3)

let warmUp = Legend(color: .blue, label: “Warm Up”, order: 2)

let low = Legend(color: .gray, label: “Low”, order: 1)
let points: [DataPoint] = [

.init(value: 70, label: “1”, legend: low),

.init(value: 90, label: “2”, legend: warmUp),

.init(value: 91, label: “3”, legend: warmUp),

.init(value: 92, label: “4”, legend: warmUp),

.init(value: 130, label: “5”, legend: fatBurning),

.init(value: 124, label: “6”, legend: fatBurning),

.init(value: 135, label: “7”, legend: fatBurning),

.init(value: 133, label: “8”, legend: fatBurning),

.init(value: 136, label: “9”, legend: fatBurning),

.init(value: 138, label: “10”, legend: fatBurning),

.init(value: 150, label: “11”, legend: buildFitness),

.init(value: 151, label: “12”, legend: buildFitness),

.init(value: 150, label: “13”, legend: buildFitness)

]
LineChartView(dataPoints: points)
Installation
Add this Swift package in Xcode using its Github repository url. (File > Swift Packages > Add Package Dependency…)
GitHub
- August 27, 2025
- SwiftUI
This package provides you with an easy way to show tooltips over any SwiftUI view, since Apple does not provide ...
- August 27, 2025
- SwiftUI
- Uncategorized
SimpleToast is a simple, lightweight, flexible and easy to use library to show toasts / popup notifications inside iOS or ...
- August 27, 2025
- SwiftUI
Create Toast Views with Minimal Effort in SwiftUI Using SSToastMessage. SSToastMessage enables you to effortlessly add toast notifications, alerts, and ...


